Splunk Investigation & Evidence Correlation
Inspect an authentication result in Splunk, then follow a separate host-and-packet investigation.
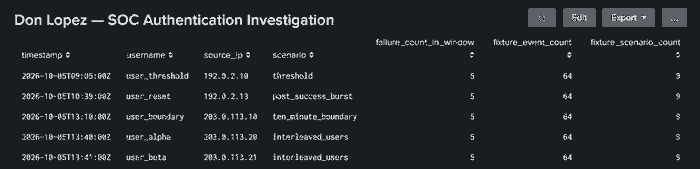
Published Splunk evidence: five expected findings on 64 synthetic authentication events. Multi-source AD correlation is separately demonstrated in Python.
The investigation problem
An authentication alert answers only part of an incident question. Understanding what happened requires connecting the account activity to relevant endpoint and network observations, while keeping the sequence and source of each event clear.
Two inspectable investigation paths
Splunk authentication: the frozen source events, corrected SPL and saved native panel preserve the original three-of-five discrepancy and the corrected five-of-five expected result. That October screenshot alone did not establish indexed ingestion or alert firing. A separate November synthetic replay later confirmed 70 indexed rows and one tracked native scheduled alert with its exact local job result; independent third-party attestation remains absent.
Recorded AD evidence: a separate Python analysis links OTRF’s authentication, Sysmon, Kerberos and packet records with same-host process GUIDs, logon sessions and bounded network context. It preserves the 39.812-second difference between a DC execution and its collection. This does not establish that the AD sources were ingested or correlated in Splunk.
Inspect the Splunk case ↗ · Inspect recorded AD correlation ↗
The investigation structure
- Identity context
- Review the account, source address, failure/success sequence and relevant authentication time range.
- Endpoint context
- Look for related execution on the affected system and distinguish suspicious commands from expected administration.
- Network context
- Correlate relevant destinations and connection timing without treating every unusual request as malicious.
- Case timeline
- Keep each event attached to its source, explain gaps and end with a reasoned disposition.
A decision, not just a dashboard
The report should explain whether the reviewed evidence supports escalation, further collection or a benign explanation. A populated dashboard alone cannot make that decision; an analyst needs to explain the relationships and remaining uncertainty.
Public work available now
Follow the source events, corrected query and observed panel in the authentication case. The AD analyst report provides the separately executed host/packet correlation, exact references and competing explanations. The analyst workflow shows how I structure validation and handoff.
Inspect the public Splunk case ↗ · Read the AD analyst report ↗ · Read my analyst workflow ↗
Explore specific investigation paths
The companion playbook develops three practical paths: failed authentication followed by success, unexpected process execution and suspicious scheduled activity. It includes starting searches and the corroborating evidence each path needs.
Academic foundation
Completed coursework: IST 5250 Incident Handling & Cyber Investigation (Fall 2024), alongside database management and big data analytics coursework.
Earlier multi-source résumé lab
My résumé describes Splunk dashboards, alert triage and correlation across three or more log sources. Its original source inventory, field mappings, dashboard/query exports and source-linked timeline are not published here. The public authentication panel and separate AD Python analysis do not independently verify that broader Splunk lab.
Scope and evidence
Splunk results use a synthetic authentication fixture; the separate AD analysis uses OTRF recorded emulation. Neither is a production incident. The AD SPL/Sigma candidates and any Splunk ingestion of the recorded AD sources remain unverified. A separate 70-event synthetic authentication run confirmed indexed data and one native scheduled alert.
Background reference
Splunk documentation: detections and source correlation ↗. This reference informs the investigation approach; it does not verify my lab results.